第11章 调试C#代码(CHAPTER 11 Debugging C# Code)
How many times do you write code, run it once to verify the result, and then declare the code tested? I hope that doesn’t happen too often. You should test your code line-by-line using a debugger. Even then, you can prove only the existence of bugs, but not their absence.
Debugging is an important task in the software development process. The .NET SDK provides tools that enable you to debug your components thoroughly. My recommendation: Use them! This chapter tells you how to use the following two tools:
- The SDK debugger
- The IL Disassembler
11.1 调试任务(Debugging Tasks)
Two debuggers ship with the .NET SDK: a command-line debugger named CORDBG and a UI debugger named SDK debugger. The latter is a stripped-down version of the Visual Studio.NET debugger, and it is the one discussed in this chapter. The SDK debugger has the following limitations when compared to its Visual Studio counterpart:
- The SDK debugger doesn’t support debugging of native code. You can debug only managed code.
- No remote machine debugging is supported. To debug code on a remote machine, you must use the Visual Studio debugger.
- The Registers window, although implemented, is not functional.
- The Disassembly window, although implemented, is not functional.
These limitations are of concern only when you debug in mixed-language or remote environments. For the bulk of debugging tasks, the SDK debugger is just fine when
- Creating a debug version of your application
- Selecting the executable
- Setting breakpoints
- Stepping through your program
- Attaching to a process
- Inspecting and modifying variables
- Managing exception handling
- JIT debugging
- Debugging components
11.1.1 为应用程序创建一个调试版本(Creating a Debug Version of Your Application)
The first step you must take before you can debug your application code is to create a debug version of your application. The debug build contains debugging information, is not optimized, and an additional PDB (program database) file for debugging and project state information is created. To create such a debug build, you add two switches to the compilation process:
csc /optimize- /debug+ whilesample.cs
This command creates two files: whilesample.exe and whilesample.pdb. Now your application is ready to be debugged. Listing 11.1 contains the source code of whilesample.cs for your review, as it is used again in the upcoming sections.
Listing 11.1 The whilesample.cs File Used for Debugging
using System;
using System.IO;

class WhileDemoApp
{
    public static void Main()
    {
        StreamReader sr = File.OpenText("whilesample.cs");
        String strLine = null;

        while (null != (strLine = sr.ReadLine()))
        {
            Console.WriteLine(strLine);
        }

        sr.Close();
    }
}
11.1.2 选择一个可执行的程序(Selecting the Executable)
The first step in setting up a debugging session is to select which application you want to debug. Although you can attach to already-running applications (shown later), the usual case is that you know upfront which application to debug. Therefore, you start that application from inside the debugger.
You have already built one application for debugging in the previous section: whilesample.exe. You now set up the SDK debugger (shown in Figure 11.1) to debug it. To start the SDK debugger, execute the application DbgUrt.exe, which resides in the folder drive:\ProgramFiles\NGWSSDK\GuiDebug.
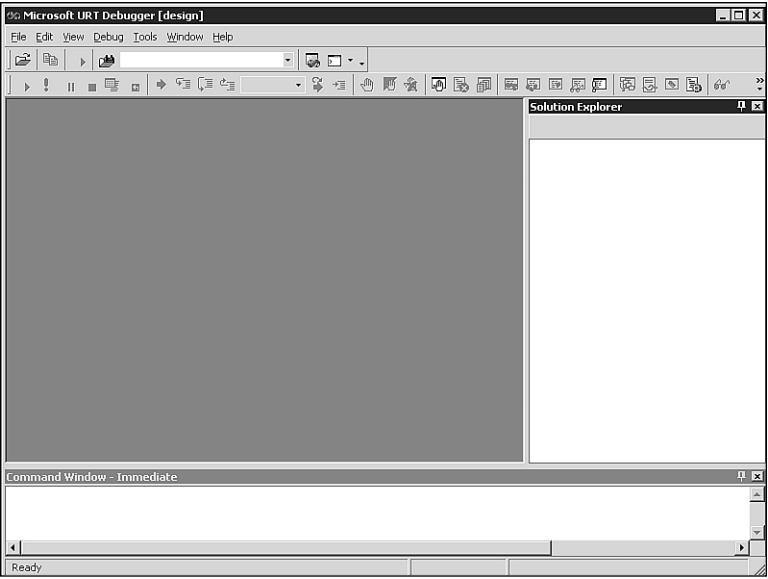
Figure 11.1 The SDK debugger main window.
To select an executable for the debugging session, open the Debug menu and choose the Program to Debug menu item. In the Program To Debug dialog box, select the appropriate program by using the browse button (its caption is …) next to the Program text box (see Figure 11.2).
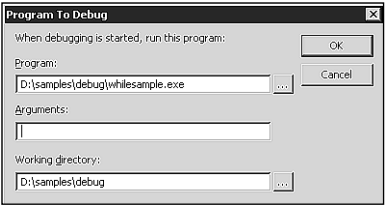
Figure 11.2 Selecting the executable for the debugging session.
Note that you can also specify command-line arguments in the Arguments text box, which are passed to the application when the debugging session is started. Because the current application does not take any arguments, leave this text box empty.
Basically, you could start the application in debugging mode immediately. However, it is a good idea to define where you want to start inspecting the code during execution by setting breakpoints.
11.1.3 设置断点(Setting Breakpoints)
You can set four types of breakpoints in your applications:
- File breakpoint—Breaks execution when a specified location (line number) in a source file is reached.
- Data breakpoint—Breaks execution when a variable (for example, a counter in a loop) changes to a specified value.
- Function breakpoint—Breaks execution at a specific location within a specified function.
- Address breakpoint—Breaks execution when a specified memory address is reached during execution.
The most commonly used kind of breakpoint is definitely the file breakpoint. Complete the following two steps to create a file breakpoint for line 11 of whilesample.cs, which is the start of the while loop.
From the File menu, choose Open/File. Search for the file
whilesample.csand open it.Go to the line where you want to place the breakpoint and right-click. Select Insert Breakpoint from the context menu. Your SDK debugger window should now resemble the one in Figure 11.3. A red dot next to the line indicates that the line contains a breakpoint (except in the case of data breakpoints).
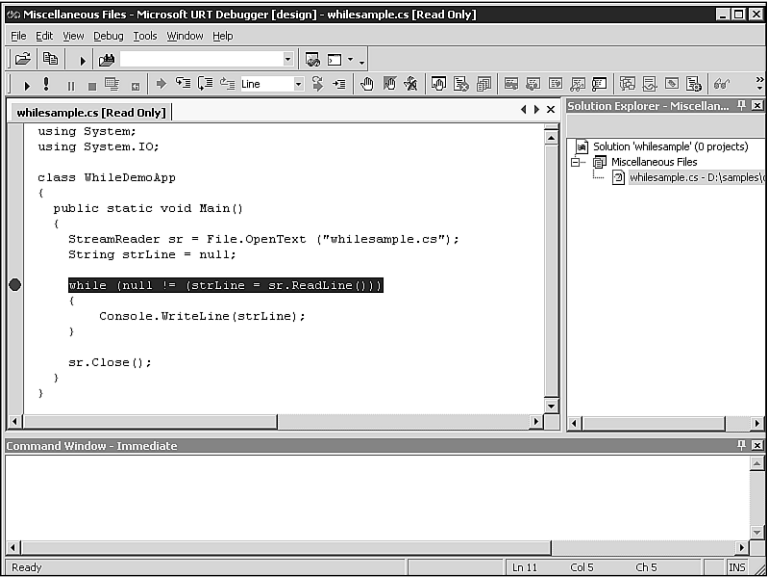
Figure 11.3 Defining a breakpoint in the SDK debugger.
That is all there is to adding a breakpoint. If you want to edit the breakpoint’s properties, simply right-click and then select Breakpoint Properties from the context menu. There you can set a breakpoint condition and click Count. This technique can be used to tell the debugger to break at the breakpoint when the breakpoint condition is satisfied for the nth time.
If you want to gain a quick overview of which breakpoints are set and which conditions and hit counts are defined, simply open the Breakpoints window. It can be accessed via the Windows/Breakpoints option in the Debug menu (see Figure 11.4).
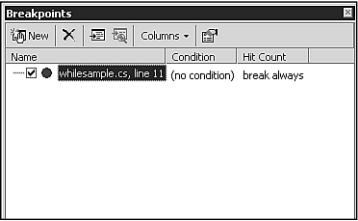
Figure 11.4 Inspecting a breakpoint in the Breakpoints window.
With a breakpoint defined, you can now start the program in debugging mode. Either select Start from the Debug menu, or click the play-button-like symbol on the Debug toolbar. Execution will break at your breakpoint, enabling you to step through your application.
11.1.4 逐句测试程序(Stepping Through Your Program)
The execution of your application is halted at a breakpoint, and you are in charge of how the application continues to run. You can execute the code statements by using the following commands (available via the Debug toolbar or menu):
- Step Over—Executes a single statement, including a simple assignment or a function call.
- Step Into—Differs from the Step Over command in that if a function is in the executed line, the debugger steps into the function. This enables you to debug function calls.
- Step Out—Enables you to step out of a function and return to the calling function.
- Run to Cursor—Executes all statements up to the point where you place the input cursor. Breakpoints between the current break position and the cursor location are honored.
Give the various commands a try in the current debugging session. When done, close the debugger.
11.1.5 添加到一个进程(Attaching to a Process)
Instead of specifying the executable upfront for the debugging session, you can pick one from the list of currently executing applications and attach to that application to debug it. This works for applications either that are executed as a service, or that depend on user interaction. Basically, the point is that you must have enough time to attach to the application before it finishes executing.
To demonstrate how this works, I will reuse the do-while example that prompts the user to enter numbers to compute an average (see Listing 11.2).
Listing 11.2 The attachto.cs File for Demonstrating Process Attaching
using System;

class ComputeAverageApp
{
    public static void Main()
    {
        ComputeAverageApp theApp = new ComputeAverageApp();
        theApp.Run();
    }

    public void Run()
    {
        double dValue = 0;
        double dSum = 0;
        int nNoOfValues = 0;
        char chContinue = 'y';
        string strInput;

        do
        {
            Console.Write("Enter a value: ");
            strInput = Console.ReadLine();
            dValue = Double.Parse(strInput);
            dSum += dValue;
            nNoOfValues++;
            Console.Write("Read another value ?");

            strInput = Console.ReadLine();
            chContinue = Char.FromString(strInput);
        }
        while ('y' == chContinue);

        Console.WriteLine("The average is { 0 }", dSum / nNoOfValues);
    }
}
Compile it using the following command (just a reminder):
csc /optimize- /debug+ attachto.cs
Execute the application at the command prompt and wait until it shows the Enter a value: prompt. Then switch to the SDK debugger.
In the .NET Debugger, choose Programs from the Debug menu. This opens the Programs dialog box, where you can choose the application that you want to debug (see Figure 11.5). Note that the SDK debugger can only be used to debug applications that are of type COM+.
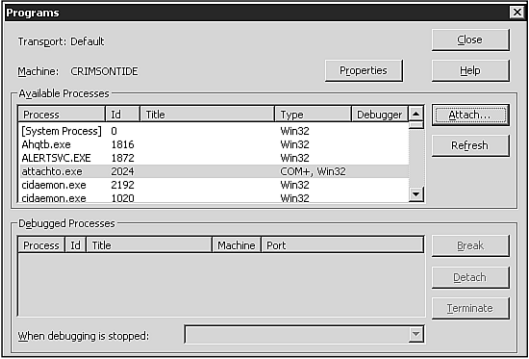
Figure 11.5 Attaching to a running program.
Click the Attach button, and click OK in the Attach to Process dialog box that opens. Note that the Programs dialog box has now changed (see Figure 11.6). A welcome addition is that you can choose either to detach from the process when you are finished debugging, or to simply terminate it.
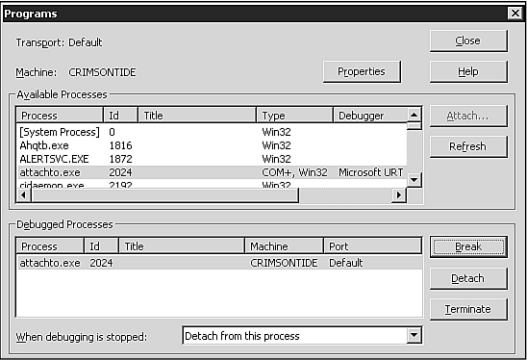
Figure 11.6 You can choose how to detach from a process after you have attached to it.
For now, click the Break button and then click Close. The source file is automatically loaded, and the cursor waits in the line where the application is waiting for the user input. Switch back to the application window, and enter a numeric value.
The next section continues with this sample. It shows you how to read and change values that are assigned to variables.
11.1.6 检查并修改变量(Inspecting and Modifying Variables)
When you return to the SDK debugger, you will notice that the debugger is still waiting in the Console.ReadLine line. Step over it to read in the value you entered. Place the cursor in line 26 and select Run to Cursor.All calculation code is executed.
Because this section is about inspecting and modifying variables, let’s begin to do so. Open the Locals window via the Debug, Windows/Locals menu option. The Locals window shows all variables that are local to the currently executing method (see Figure 11.7).
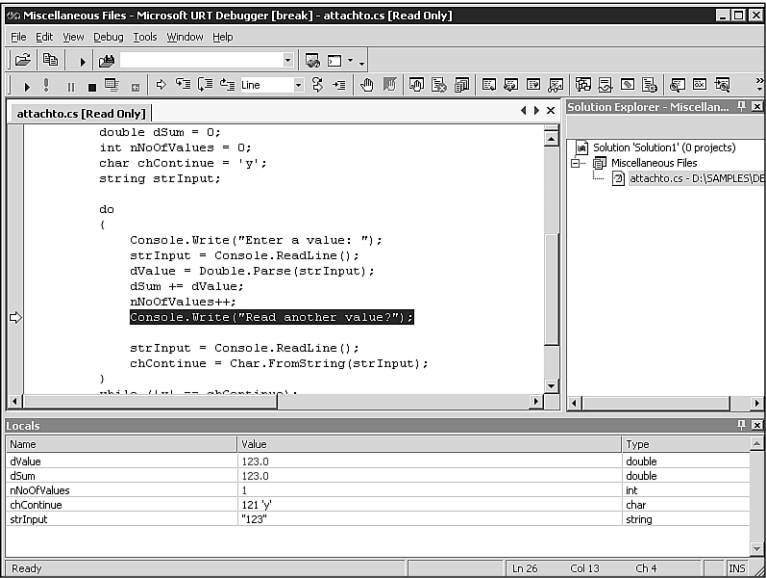
Figure 11.7 Viewing the variables that are local to the current method.
To modify a variable’s value, double-click in the Value column of that variable. Enter a new value and press the Enter key. That’s all you have to do.
Another window of interest is Watch. In contrast to the Locals window, Watch doesn’t show any variables by default. You must enter the variables you want to watch by clicking the Name column and entering the variable’s name. However, the variables always stay in the Watch window even if you jump between methods. Use the Watch window to track variables of interest.
11.1.7 管理异常事件处理(Managing Exception Handling)
A really cool feature of the SDK debugger is how you can deal with exceptions. With an application selected for debugging, you can open the configuration window for exceptions via the Debug, Exceptions menu choice. Figure 11.8 shows the Exceptions dialog where you can configure how the debugger should react to various exceptions.
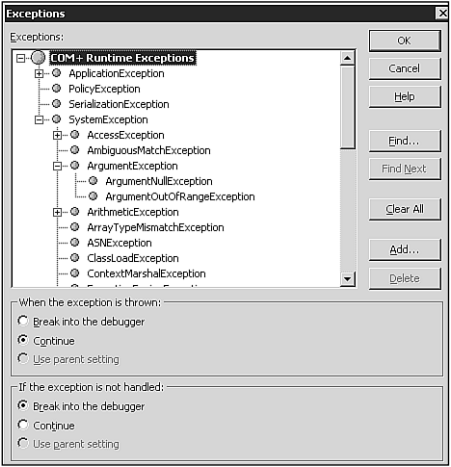
Figure 11.8 Defining how the SDK debugger should react to different exceptions.
The default setting is to continue execution when an exception is thrown and, if the exception is not handled by your code, to break into the debugger. All listed exceptions inherit this default—their Use Parent Setting radio button is selected.
Although the defaults in place enable you to find exceptions that are not handled in your code, you might feel the need to change the behavior for certain exceptions. You might want to continue execution when an argument exception is thrown but not handled, or you might decide to break into the debugger automatically when a FileIOException is thrown (before the handler is invoked).
11.1.8 JIT调试(JIT Debugging)
Exceptions are an excellent starting point for a debugging session anyway. When an exception is not handled properly by your code, you are prompted to start debugging (see Figure 11.9). This is called JIT (just in time) debugging.
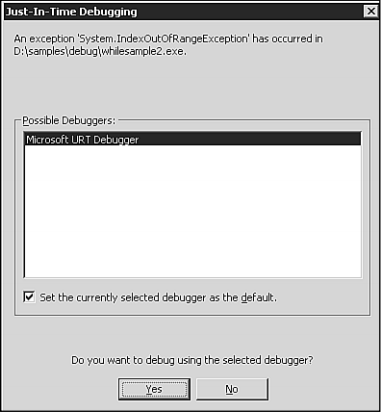
Figure 11.9 Exceptions enable you to JIT debug your application.
The SDK debugger starts when you choose to perform JIT debugging. Give your okay to attach to the process in question, and the debugger automatically opens the source file and places the cursor in the offending line. In addition, you are notified about which exception has occurred (see Figure 11.10).
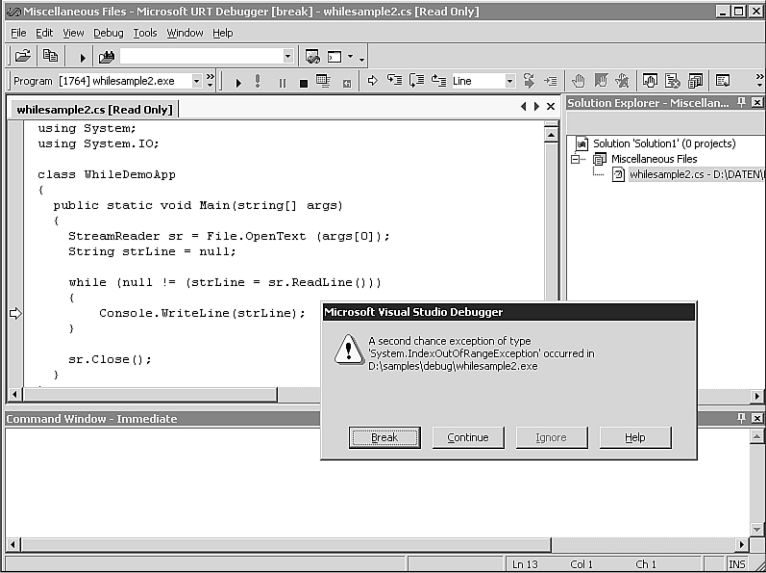
Figure 11.10 The debugger tells you which exception caused the JIT debugging session.
You can now debug the application to your heart’s content by using the techniques that were outlined in this chapter.
11.1.9 调试组件(Debugging Components)
Debugging C# components isn’t that different from debugging components written in C++: You must attach to a client application that uses the component, and then add breakpoints to the component’s source code (or wait for an exception). The client application need not be compiled for use in debugging mode, but I recommend this.
Once again, the namespaced version of our component DLL is used as an example. The compiler switches are as follows:
csc /r:System.Net.dll /t:library /out:csharp.dll /a.version:1.0.1.0 /debug+ /optimize- whoisns.cs wrqns.cs
Write a client application, and compile it as a debug version:
csc /r:csharp.dll /out:wrq.exe /debug+ /optimize- wrqclientns.cs
You are now free either to start the client application in a debugging session, or to start it in a command window and then attach to it. When both the client and the component are written in managed code and are compiled as a debug version, you can step from client code into component code.
11.2 中间语言分解器(The Intermediate Language Disassembler)
A nifty tool that comes with the .NET SDK is the Intermediate Language (IL) Disassembler, or ILDasm. Despite the task that its name implies, you can use the IL Disassembler to gain important knowledge about the metadata and manifests of your .NET executables. Use this tool, for example, when you have created an RCW (Runtime Callable Wrapper) for a COM component and want to learn more about the wrapper class.
You can start the IL Disassembler from the Tools submenu of the Microsoft .NET SDK start menu. Initially, the window is empty, but when you select an .NET component via the File, Open menu option, all types are displayed and you can browse the namespaces (see Figure 11.11).
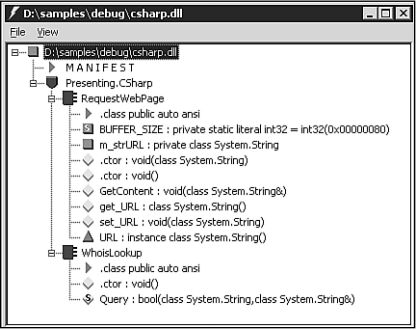
Figure 11.11 Using ILDasm to browse an .NET component.
When you double-click MANIFEST, you can see which libraries were imported, and gain information (version number, and so on) about the manifest for the component itself.
A feature for advanced programmers who really want to know more is that ILDasm can show the IL assembly code that was generated for a specific method (see Figure 11.12). Because it is annotated with the actual C# source code (debug only), you can easily learn how IL works.The IL instructions are documented in the .NET SDK.
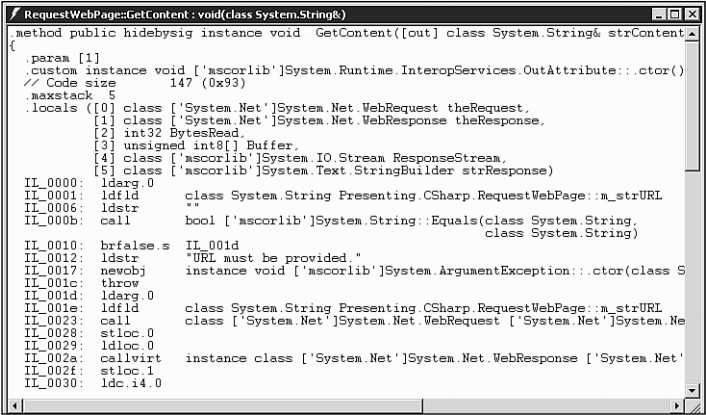
Figure 11.12 Viewing the IL for the GetContent method.
11.3 小结(Summary)
In this chapter, you learned how to use the SDK debugger that ships with the .NET SDK. Because the SDK debugger is a minimally stripped-down version of the Visual Studio debugger, it provides a wealth of debugging functionality, which makes it a snap to test your applications.
You can start a debugging session with a certain executable, or you can attach to one that is already running. On hitting a breakpoint, you can step into, step out of, step over, or run to a cursor position. Variable inspection and modification are, of course, also possible. With the very flexible exception handling provided, you can very thoroughly examine your application.
For those who like assembly language, the IL Disassembler is a tool they’ll really enjoy—they can easily learn the IL statements and interpret the code. For the rest of us, the IL Disassembler is an important tool to learn more about a component’s manifest and metadata.